Stephen Williamson wrote a fantastic post, where he bounds reasonable numbers for employment growth and the unemployment rate, in the U.S., in coming months.
Takeaways:
-200k jobs added per month, which many observers find normal, is more than we can reasonably expect.
-Recent trends and the current level of labor force participation suggest that employment can't grow faster than 0.5% for too long. 200k jobs per month imply a 1.7% growth rate, given the current level of unemployment.
-The unemployment rate can't probably get much lower than 4.6%.
-Going forward, monthly employment growth should be closer to 60k (population growth) than the "normal" 200k.
Showing posts with label unemployment. Show all posts
Showing posts with label unemployment. Show all posts
Wednesday, October 14, 2015


Tuesday, May 19, 2015
Graphic content: Unemployment rates town by town, in Spain
Beautiful map on unemployment rates on datosmacro.com. If you go to the website you can click on each town and see its name and unemployment rate.
Notice the clusters of high unemployment in Castilla La Mancha, Cádiz-Huelva-Sevilla, and León-Galicia.

The map, however, is misleading if you try to infer comparisons of regional unemployment. For instance, it would seem that Galicia's (northwest) unemployment rate is much, much higher than Catalonia's (northeast). Wrong: Galicia's jobless rate in 2015:Q1 was 21.8%, whereas Catalonia's was 20.1%.
Notice the clusters of high unemployment in Castilla La Mancha, Cádiz-Huelva-Sevilla, and León-Galicia.

The map, however, is misleading if you try to infer comparisons of regional unemployment. For instance, it would seem that Galicia's (northwest) unemployment rate is much, much higher than Catalonia's (northeast). Wrong: Galicia's jobless rate in 2015:Q1 was 21.8%, whereas Catalonia's was 20.1%.
Thursday, November 20, 2014
Don't dismiss the long-term unemployed
The long-term unemployed matter. That might be the conclusion from a trio of blog posts by New York Fed researchers, over at Liberty Street Economics. (The authors are Rob Dent, Samuel Kapon, Fatih Karahan, Benjamin W. Pugsley, and Ayşegül Sahin.)
In the first part they compare the observable characteristics of four groups of potential workers: the short-term unemployed, the long-term unemployed, nonparticipants who say they want a job, and nonparticipants who say they don't to work. In particular, they compare the distributions of gender, age, race, education, occupation and industry across groups (see the charts below).


The authors conclude that "on the basis of these observable characteristics, we find that long-term unemployed workers are not less attached to the labor market than short-term unemployed workers" (emphasis mine).
The emphasis on observable characteristics is important. There might be other, unobserved characteristics that affect the supply or demand of labor, and so it would be incorrect to imply that labor force attachment, employability, etc. is the same across groups. Motivation and family responsibilities are two examples, off the top of my head, of such unobserved characteristics (unobserved to us, not to job seekers or employers). The authors do acknowledge this: "While there may be unobservable characteristics of long-term unemployed workers that make them less attached to the labor force..."
In the second part the authors find that the short-term unemployed are more likely to find a job than the long-term unemployed, both within one month and within one year. At the one-month horizon, the long-term unemployed and nonparticipants who want a job have almost the same odds of finding a job, but at the one-year horizon long-term unemployed are more likely to find a job than nonparticipants. Finally, they estimate the dropout rate (fraction who leave the labor force) by group, with the expected results.


In the third part, they find little evidence that long-term unemployed exert less pressure on wages than short-term unemployed.
My take from those blog posts is that the long-term unemployed are not like non-participants, and shouldn't be dismissed as just "dropouts by another name." They are probably somewhere between short-term unemployed and nonparticipants, in terms of likelihood of getting a job, and not starkly different from other groups in terms of demographic characteristics.
In the first part they compare the observable characteristics of four groups of potential workers: the short-term unemployed, the long-term unemployed, nonparticipants who say they want a job, and nonparticipants who say they don't to work. In particular, they compare the distributions of gender, age, race, education, occupation and industry across groups (see the charts below).
The authors conclude that "on the basis of these observable characteristics, we find that long-term unemployed workers are not less attached to the labor market than short-term unemployed workers" (emphasis mine).
The emphasis on observable characteristics is important. There might be other, unobserved characteristics that affect the supply or demand of labor, and so it would be incorrect to imply that labor force attachment, employability, etc. is the same across groups. Motivation and family responsibilities are two examples, off the top of my head, of such unobserved characteristics (unobserved to us, not to job seekers or employers). The authors do acknowledge this: "While there may be unobservable characteristics of long-term unemployed workers that make them less attached to the labor force..."
In the second part the authors find that the short-term unemployed are more likely to find a job than the long-term unemployed, both within one month and within one year. At the one-month horizon, the long-term unemployed and nonparticipants who want a job have almost the same odds of finding a job, but at the one-year horizon long-term unemployed are more likely to find a job than nonparticipants. Finally, they estimate the dropout rate (fraction who leave the labor force) by group, with the expected results.
In the third part, they find little evidence that long-term unemployed exert less pressure on wages than short-term unemployed.
My take from those blog posts is that the long-term unemployed are not like non-participants, and shouldn't be dismissed as just "dropouts by another name." They are probably somewhere between short-term unemployed and nonparticipants, in terms of likelihood of getting a job, and not starkly different from other groups in terms of demographic characteristics.
Monday, September 29, 2014
What caught my eye
1. Labor under-utilization: We keep thinking, long and hard, about how much slack there is in the job market. Gavyn Davies brings our attention to a timely conference put on by the Peterson Institute. The "consensus" --at least as gauged by Davies-- is that the unemployment rate in the U.S. under-represents the true amount of slack, due to the effect of the participation gap and involuntary part-time employment. Moreover, because of long-term unemployment and the potential rise of productivity growth, a decline of labor slack need not be as inflationary as it normally would. Everybody, however, acknowledges the "great uncertainty" around these assessments.
The Peterson Institute has posted the videos and ppt files of all the conference presentations here.
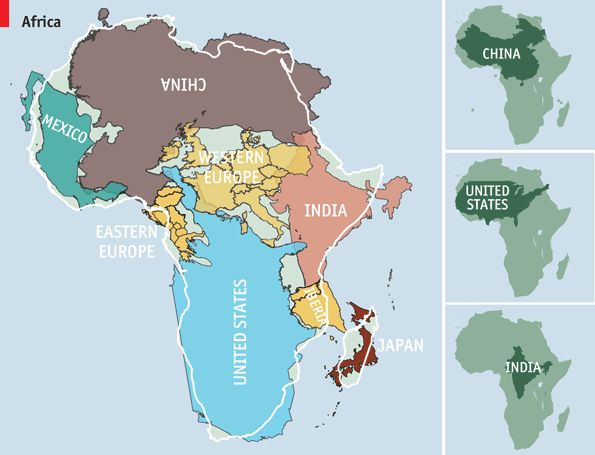
2. "Grapho-tainment": Twenty-two maps and charts that will surprise you, by Vox.com. I love these: #1, #3, #7, #10, #15, #17, and #19.
3. Speech by Vítor Constâncio, vice-president of the ECB, on "understanding the yield curve." I liked this [emphasis mine]:
5. From this week's batch of NBER working papers [emphasis mine]:
The paper is by Horag Choi, Steven Lugauer, and Nelson Mark, and here's an ungated version.
2. "Grapho-tainment": Twenty-two maps and charts that will surprise you, by Vox.com. I love these: #1, #3, #7, #10, #15, #17, and #19.
3. Speech by Vítor Constâncio, vice-president of the ECB, on "understanding the yield curve." I liked this [emphasis mine]:
Moreover, high sovereign spreads in the euro area have raised the question of what is the appropriate yield curve to monitor. In an article in the July Monthly Bulletin we discussed this issue in the context of measuring the euro area risk-free rate. Should we use Bund yields, euro area average AAA rates or OIS rates, or does it depend on the matter at hand?4. David Keohane at FTAlphaville shares a report by HSBC, on the uneven conditions for growth across states in India.
Incidentally, an intriguing question in a currency union is the following: if it is difficult to identify a risk-free rate in a currency union, this means that there is no risk-free asset either, besides the central bank's own liabilities, the currency.
5. From this week's batch of NBER working papers [emphasis mine]:
We employ a model of precautionary saving to study why household saving rates are so high in China and so low in the US. The use of recursive preferences gives a convenient decomposition of saving into precautionary and non precautionary components. This decomposition indicates that over 80 percent of China’s saving rate and nearly all of the US saving arises from the precautionary motive. The difference in the income growth rate between China and the US is vastly more important for explaining saving rate differences than differences in income risk. We estimate the preference parameters and find that Chinese and US households are more similar in their attitude toward risk than in their intertemporal substitutability of consumption.I find the statement in bold very, very hard to believe, given this.
The paper is by Horag Choi, Steven Lugauer, and Nelson Mark, and here's an ungated version.
Thursday, August 21, 2014
Public education as an unemployment subsidy
From Bloomberg News: Eight years of college lets Finns hide from labor market.
“When I tell people I’m a student, it tells them I’m achieving something compared to being jobless,” he said, sipping green tea at a cafe near the university’s main building. “In reality, there might not be such a big difference.”
Finnish students stay in college longer than in any other developed country save Austria, the Netherlands and Denmark, getting their first university degree on average at 29, according to a 2013 report by the Organization for Economic Cooperation and Development. That compares with 24 years for Britons, 26 for Germans and the OECD average of 27 years. Most Finns who graduate from college get a master’s degree.
Easing the long years in college is the fact that students aren’t required to pay tuition. The state also provides grants of as much as 500 euros ($670) a month plus meal support and loans of as much as 400 euros a month.
[...]
While Finland’s two recessions since 2008 have pushed companies to cut jobs, unemployment has risen less than in many of its European peers. At the same time, so-called hidden unemployment is on the rise. The number of people not seeking work though they’d like to find it increased 10 percent in June from a year earlier.
[...]
Only about 50 percent of all university students graduate in five-and-a-half years or less, Helsinki-based Statistics Finland says. One-third of graduates are 30 years old or more, compared with an EU average of 17 percent, Eurostat says.
“School has traditionally acted as a buffer when the economic situation is bad,” said Ulla Haemaelaeinen, a senior researcher at the Finnish Social Insurance Institution in Helsinki. “It’s a policy choice.”
Subscribe to:
Posts (Atom)